Google Analytics 4 custom report recipes

Create Custom Reports in Google Analytics (GA4) with These Tutorials

By:

While the launch of Google Analytics 4 (GA4) offers more flexibility regarding custom reporting and analysis, it has been a challenge for users who are used to the structured reports in Universal Analytics (UA). The new data model, metrics, and reporting interface require users to unlearn some of the concepts they’ve grown accustomed to in UA. 

GA4’s lack of predefined reports and the need to create custom reports in Google Analytics from scratch can be time-consuming and overwhelming, particularly for those without advanced analytics skills. Never fear, Intellithought can help you set up your first custom reports tailored to your marketing objectives. 

Create Custom Reports in Google Analytics (GA4)

While the standard reports in GA4 provide valuable insights, creating custom reports in GA4 allows you to focus on specific data points that matter most to your business helping you make more informed decisions. You can create detailed views of user interactions, segment data by custom dimensions, and apply filters to analyze particular aspects of your audience’s behavior. This flexibility makes custom reports a powerful feature for businesses looking to dive deeper into their analytics.

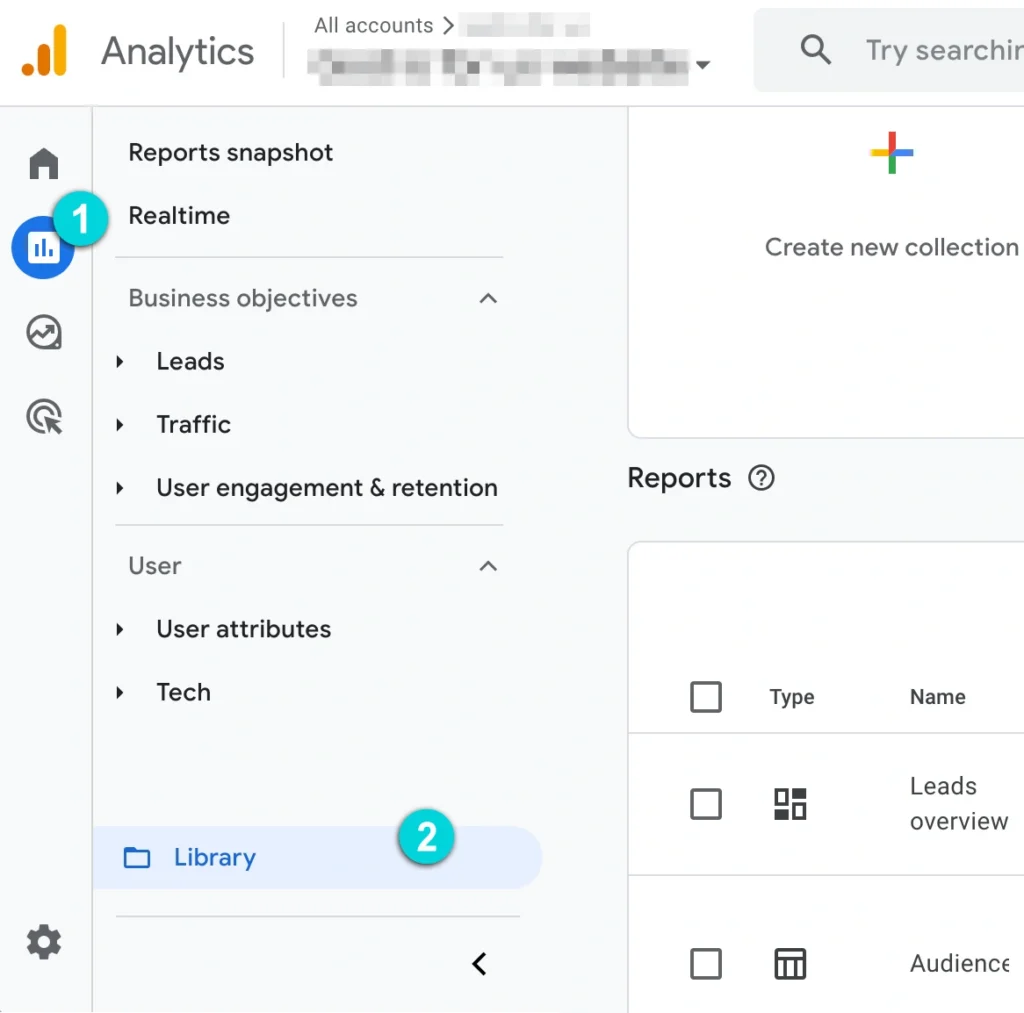
To start creating your custom reports, you first need to sign into your Google Analytics account and then navigate to Reports > Library

From here, you can either choose to edit an existing report and customize it to your needs or you can create a new report.

How To: Custom Report Tutorials

Click on one of the custom report topics below for tutorial.

To create a report that shows where your website’s visitors are coming from, you can duplicate and edit the existing “Demographic details” report.

1. First, locate “Demographic details” from the list of Reports. Click on the 3 dots icon (⋮) in the far right and select Make a copy in the drop-down menu. From the resulting pop-up window, name your report and optionally add a description.

2. You’ll then see your newly created report at the top of the Reports list. Locate your created report and click the 3 dots icon (⋮) in the far right and select Edit in the drop-down menu.

3. After clicking edit, you should see the Edit Report view with a Customize Report sidebar on the right side. Click on Dimensions.
Click the 3 dots icon (⋮) on City and select Set as default in the drop-down menu. Finally, click the blue Apply button

4. You should now see City as the first column in your Top Locations table. To set a secondary dimension for your Region (or State), click on the blue plus next to City in your table

5. From the popup, search for “region” and select Region in the results

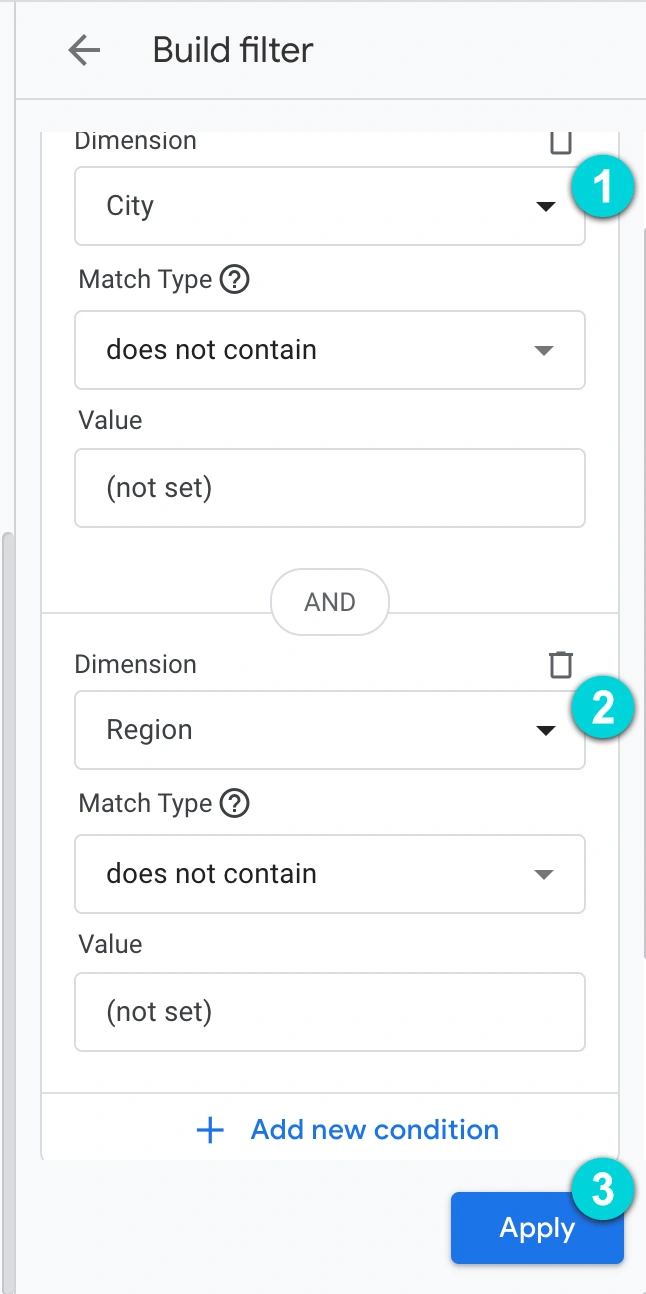
6. For locations, you’ll more than likely see (not set) in City, Region, or both. If you’d like to filter those out, you can select Add filter under the Customize report sidebar. Under Build filter, add a condition that City |does not contain and then under value type “(not set) ”. Do the same for Region. Once finished, click the blue Apply button.

7. You also have the option to edit the Metrics for your data table by selecting Metrics under the Customize report sidebar. From there, you can delete, add, and drag / re-sort the Metrics shown in your data table.

8. Once you have your report how you want it, you can save your report by clicking the blue Save… button at the top of the edit view next to your report’s name. From the dropdown, choose Save changes to the current report.

If your website has a search bar and you’d like to know what keywords your users are searching for, you can create a custom report using the steps below.

1. From the Reports > Library view, click the blue Create new report button and from the dropdown, choose Create detail report

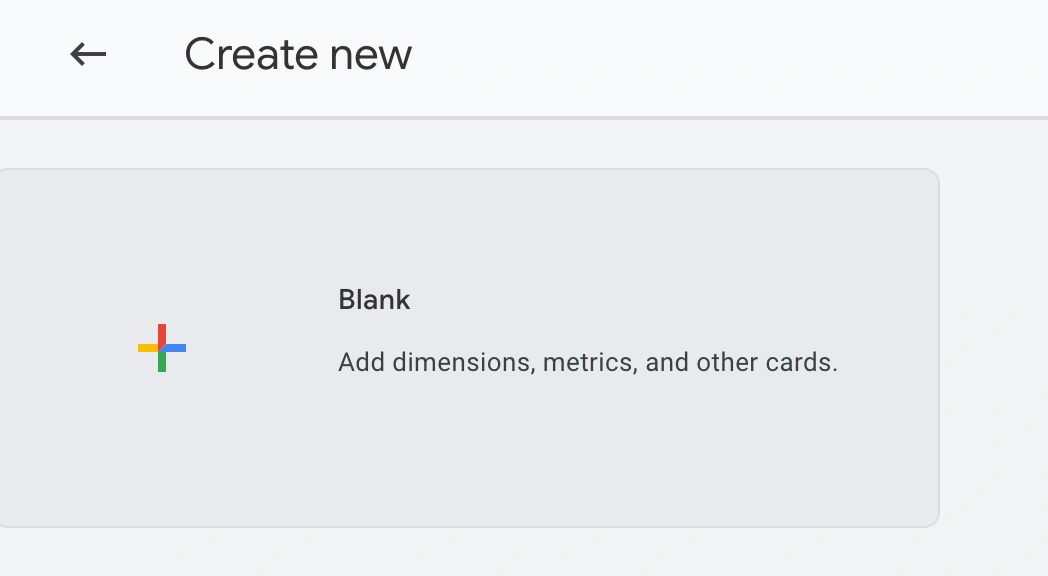
2. Under the Create new heading, choose Blank

3. In the Edit Report view, click on + Add dimensions. Under the Dimensions header in the sidebar, click on the Add dimension select box and choose Search term. Finally, click the blue Apply button.

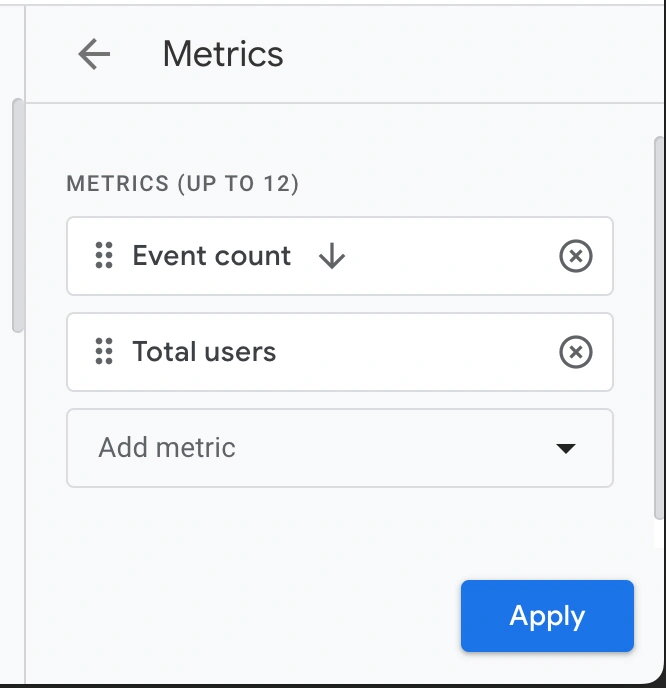
4. Next, click on + Add Metrics. Under the Metrics header in the sidebar, click on the Add metric select box and choose Event Count. Add another metric and choose Total Users. Finally, click the blue Apply button.

5. Once you have your report how you want it, you can save your report by clicking the blue Save… button at the top of the edit view. From the resulting popup, give your report a name and optional description. Finally, click the Save link.

If you’d like to track your social media and referral traffic, you can create a custom report using the steps below.

1. From the Reports > Library view, click the blue Create new report button and from the dropdown, choose Create detail report

2. Under the Create new heading, choose Blank

3. In the Edit Report view, click on + Add dimensions. Under the Dimensions header in the sidebar, click on the Add dimension select box and choose First user source. Finally, click the blue Apply button.

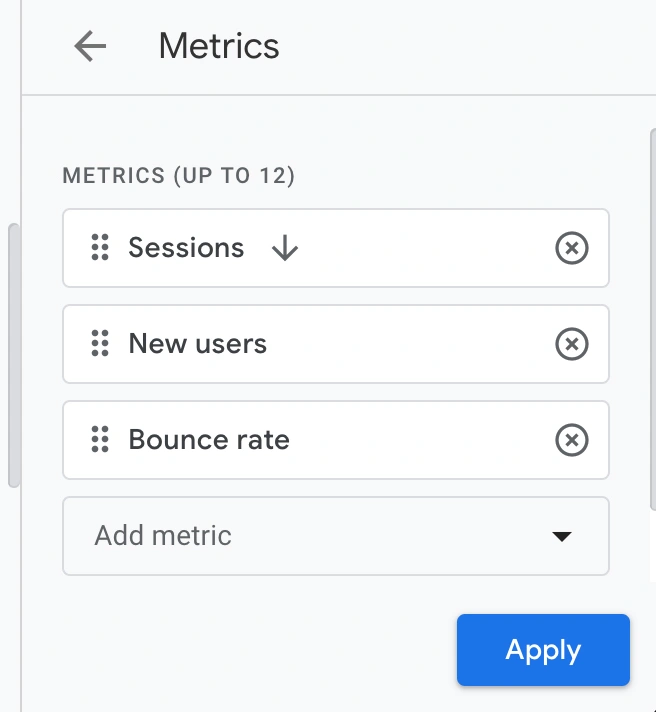
4. Next, click on + Add Metrics. Under the Metrics header in the sidebar, click on the Add metric select box and choose Sessions. Add another metric and choose New Users. Add another metric and choose Bounce Rate. Finally, click the blue Apply button.

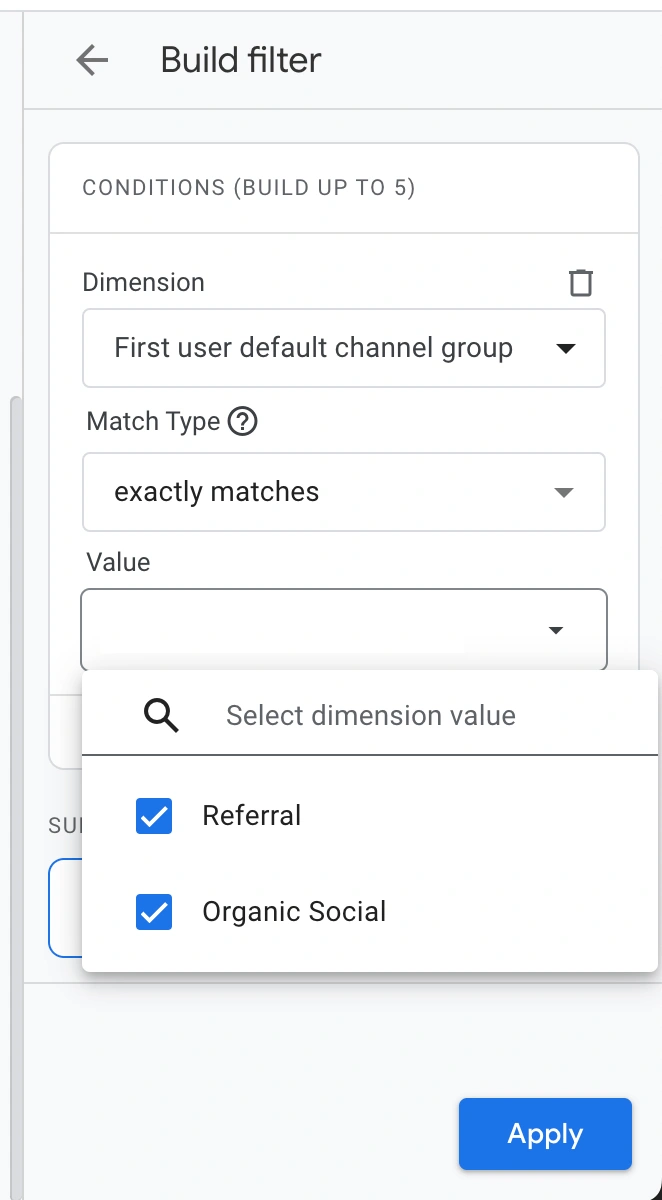
5. Under the Customize report heading in the sidebar, click + Add filter. Under the Build filter, set the following conditions: First user default channel group | exactly matches | ‘Organic Social’ OR ‘Referral’

6. Once you have your report how you want it, you can save it by clicking the blue Save… button at the top of the edit view. From the resulting popup, give your report a name and optional description. Finally, click the Save link.

If you run paid search ads with Google, you can create a custom report to track the top keywords bringing users to you by doing the following.

1. From the Reports > Library view, click the blue Create new report button and from the dropdown, choose Create detail report

2. Under the Create new heading, choose Blank

3. In the Edit Report view, click on + Add dimensions. Under the Dimensions header in the sidebar, click on the Add dimension select box and choose Session Google Ads keyword text. Finally, click the blue Apply button.

4. Next, click on + Add Metrics. Under the Metrics header in the sidebar, click on the Add metric select box and choose Sessions. Add another metric and choose Google Ads clicks. Add another metric and choose Google Ads cost. Add another metric and choose Google Ads cost per click. Finally, click the blue Apply button.

5. Once you have your report how you want it, you can save your report by clicking the blue Save… button at the top of the edit view. From the resulting popup, give your report a name and optional description. Finally, click the Save link.

If you have email marketing and would like to track which pages get the most traffic from links in emails, you can create a custom report using the steps below.

1. From the Reports > Library view, click the blue Create new report button and from the dropdown, choose Create detail report.

2. Under the Create new heading, choose Blank

3. In the Edit Report view, click on + Add dimensions. Under the Dimensions header in the sidebar, click on the Add dimension select box and choose Landing page. Finally, click the blue Apply button.

4. Next, click on + Add Metrics. Under the Metrics header in the sidebar, click on the Add metric select box and choose Sessions. Add another metric and choose New Users. Add another metric and choose Bounce Rate. Finally, click the blue Apply button.

5. Under the Customize report heading in the sidebar, click + Add filter. Under the Build filter, set the following conditions: First user default channel group | exactly matches | ‘Organic Social’ OR ‘Referral’

6. Once you have your report how you want it, you can save it by clicking the blue Save… button at the top of the edit view. From the resulting popup, give your report a name and optional description. Finally, click the Save link.

Adding Your Reports to a Collection

If you want your custom reports to show up in the left-hand sidebar for quick access and the ability to change date ranges, you will want to place your newly created custom reports in a collection. To set up and publish your collection, follow the next steps below.

1. From the Reports > Library view, click the Create new collection button

2. Under the Create new collection heading, choose Blank

3. On the next screen in the left side panel, click the title to rename it to whatever you want. I named mine “Custom Reports” for this example. You’ll then click the + Create new topic below to categorize your custom reports. Once the topic is created, drag your custom report from the right side panel to your topic section in the left side panel. Click the blue Save button. Once your collection is saved, click the Back link in the top left of the screen.

4. Under the Collections header, locate your Collection. Click the () button and then click Publish.

5. You should now see your collection of custom reports in the left-side navigation of the Google Analytics Reports view

While the standard reports in GA4 provide valuable insights, creating custom reports allows you to tailor the data to your specific needs, helping you make more informed decisions. By following the steps outlined in this guide, you can create, customize, and share reports that provide valuable insights into your website or app’s performance. Whether you’re a seasoned analyst or new to GA4, custom reports offer a powerful way to unlock the full potential of your data. Happy Analyzing!

If you are interested in learning more about Intellithought’s Strategy & Consulting and SEO services, get the conversation started below!


More in ,